Single Trapped Nanoparticles
This new project has a number of goals:
1. Continuing development of nanoparticle mass spectrometry (NPMS) as a tool for nanoparticle
characterization.
2. Use of NPMS to probe the optical properties of fluorescence nanoparticles, such
as semiconductor quantum dots.
3. Development of NPMS-based tools to study surface chemistry on individual nanoparticles
at high temperatures.
4. Use of NPMS for high precision mass spectrometry of biological nanoparticles such
as viruses.
 NPMS is based on trapping individual nanoparticles (NPs) in a quadrupole trap, and
measuring the frequency, ωz, of their oscillatory �secular� motion, from which the
mass/charge ratio, M/Q, can be calculated.� , where V0 and Ω are the amplitude and
frequency of the radio-frequency trapping voltage applied to the trap, and z0 is a
characteristic dimension of the trap.
Our current instrument is shown in the figure. To introduce NPs into the trap, we
use an electrospray source, which has proved to be efficient for introduction of all
different types of NPs in mass ranges from 200 kiloDalton (kDa) to > 3 gigaDalton
(GDa), corresponding to diameters from a few to a few hundred nanometers. �NPs are
pre-filtered by a linear quadrupole guide/trap which rejects molecular ions or NPs
with M/Q outside the desired range.� Once trapped, the NP is detected optically, using
light scattering for large particles, and laser-induced fluorescence (LIF) for small
particles, with light detected by an avalanche photodiode/multichannel scalar system.�
The instrument is also equipped with a cw CO2 laser that can be used to heat particles
for cleaning or to drive surface chemistry.� If the particles are hot enough, then
thermal photon emission can also be used as a detection method.
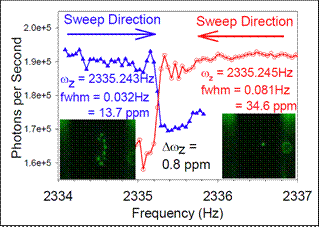
 High precision NP mass measurements: The best previous mass precision for NPMS was 100 ppm in a single measurement, improved
to ~10 ppm by an hour of averaging. The figure to the left shows two scans for a single
NP, measuring the frequency associated with secular oscillation in the axial direction
(ωz). The step inflection points of the two scans (=ωz) agree to within ~0.8 ppm,
and the long term M/Q repeatability (i.e., the precision) is ~2 ppm. To determine
Q, and hence M, we measure the steps in ωz that occur when the NP changes charge by
a single electron (see below).� For the NP in the figure, Δωz was 0.379937 Hz/electron,
and the NP mass was, therefore, 5.944639 � 0.000047 fg, or 3.580030 GDa.� The left
inset in the figure shows a small Coulomb crystal formed by an ensemble of NPs initially
injected into the trap.� This ensemble was subsequently selectively reduced to yield
a single NP in the trap (right inset). �In this case, the NPs are ~200 nm in diameter,
allowing detection and imaging by light scattering.
 Optical properties of quantum dots:� Most of our work has focused on measuring optical properties of semiconductor quantum
dots (QDs) and small aggregates of QDs. QDs (<10nm dia) are detected using LIF.� We
are able to selectively inject, detect, mass analyze, and manipulate single QDs, and
also single NPs composed of a few aggregated QDs .� NPs can be studied for many hours,
as they are heated, reacted, and probed by lifetime and spectral measurements. Single
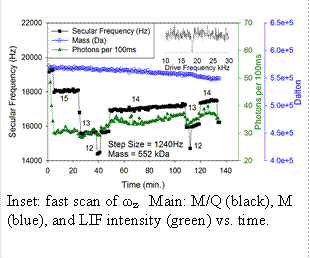
QDs: Example data for a single QD is shown in the figure.� Conditions were optimized
for rapid ωz determination (Ptrap = 10-3 Torr of argon, fast ωz scan rate) giving
M/Q with ~0.2% precision every ~10 sec. The inset shows a fast ωz scan, where ωz appears
as a peak due to collisional damping from the argon buffer gas.� If needed, periodic
slow scans can be made to obtain higher precision, although for small particles like
QDs, moderate precision is often sufficient. The main figure shows how the secular
frequency, ωz, changes with time.� Note the quantized steps, due to changes in charge
(integers next to each step), resulting from collisions with electrons, Ar+, or Ar*
created by a discharge. The step size allows determination of Q, and therefore M,
which is also plotted as a function of time.� This QD had a starting mass of 572 kDa,
in the middle of the nominal mass range for the QDs used (7 nm +/- 10% diameter� =~
370 - 680 kDa). This mass does not include the estimated ~140 kDa of ligands, however,
this QD was first heated via CO2 laser, and evidence suggests that much of the ligand
mass is lost in the process. In this example, we see slow mass loss due to heating
by the LIF laser. Note also that during the initial few minutes, while Q = 16, there
was a factor of ~2 decrease in LIF intensity, which stabilized as soon as the step
to Q=15 occurred.� One goal of the proposed work is to understand these correlations
between properties such as M, Q, and surface chemistry, and fluorescence intensity
and lifetime.
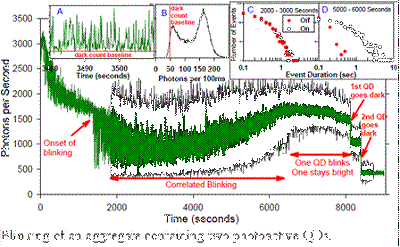
 QD Aggregates: Some of our most interesting results have been obtained for small aggregates of QDs.
This figure gives an example, where a single NP, containing two photoactive QDs, was
studied for ~3 hours at low LIF laser intensity, during which time it underwent a
number of behavior changes.� The main figure shows intensity vs. time, with both 1
sec (green) and 100 msec (black) time binning. After an initial period where the intensity
dropped, the NP settled into a stable period of blinking (intermittent fluorescence),
starting at ~1800 sec., and running until ~6000 sec. Inset A shows 30 sec of typical
blinking, and Inset B shows a histogram of intensities over the 2000-6000 sec time
range.� Note that despite there being two active emitters, the intensity is strongly
bimodal, suggesting that emission from the two QDs is correlated, such that they are
either both bright or both dark during this time period.� Although the behavior is
broadly stable between 1800 and 6000 sec, the emitters are actually changing slowly,
as shown by the changes in the distributions of time spent in the �On� and �Off� states.�
Initially, the On and Off time distributions (Inset C) are quite similar, and both
depart from power law dependence. �Late in the blinking record (Inset D), the probability
of long On intervals increases, and the probability of long Off intervals decreases,
i.e., the duty factor increases substantially with time.� At ~6500 seconds, blinking
continues, but the brightness of the �Off� state increases to ~half the �On� brightness,
indicating that one of the QDs is �stuck On� continuously. Just before 8000 seconds,
the brightness begins to decrease, suggesting that the quantum yield for one or both
QDs is dropping, and then at ~8000 and ~8500 seconds there are two abrupt transitions
dropping the intensity to baseline, indicating that first one, and then the other
QD bleached.� We are in the process of collecting additional aggregate time records,
in order to assemble a statistically meaningful picture of the range of photophysical
behavior they can exhibit.�
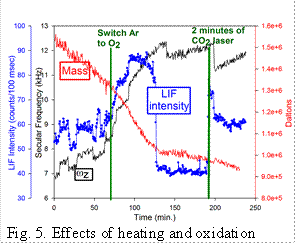
 Heating/oxidation effects: We also have studied the effects of heating QDs in both inert and oxidizing environments.�
This figure shows an example of the behavior for a small aggregate containing 3 to
4 QDs which was trapped and briefly exposed to the CO2 laser at time < 0 to desorb
ligands. LIF was pumped by a cw 532 nm laser at moderate power, resulting in significant
heating. The ωz trace shows the charge stepping needed to establish Q, and the �Mass�
trace indicates shows mass loss by sublimation from the hot particle.� At ~70 min,
the Ar buffer was replaced with 10-3 Torr of O2, and it can be seen that the rate
of mass loss increased, suggesting oxidative volatilization.� During this rapid mass
loss, the emission intensity nearly doubled. At ~125 min, the rate of mass loss abruptly
slowed, and at this point there was a sudden ~50% decrease in LIF intensity. The conclusion
is that surface chemistry has a major effect on emission, suggesting that emission
is from trap states associated with the surface. After tracking the oxidized NP for
an hour, we hit it with the CO2 laser (~5 kW/cm2) for 2 minutes, and the LIF brightened
substantially, even though there was no obvious mass change, again suggesting that
subtle changes in surface chemistry strongly affect fluorescence quantum yield.
